TokenViz
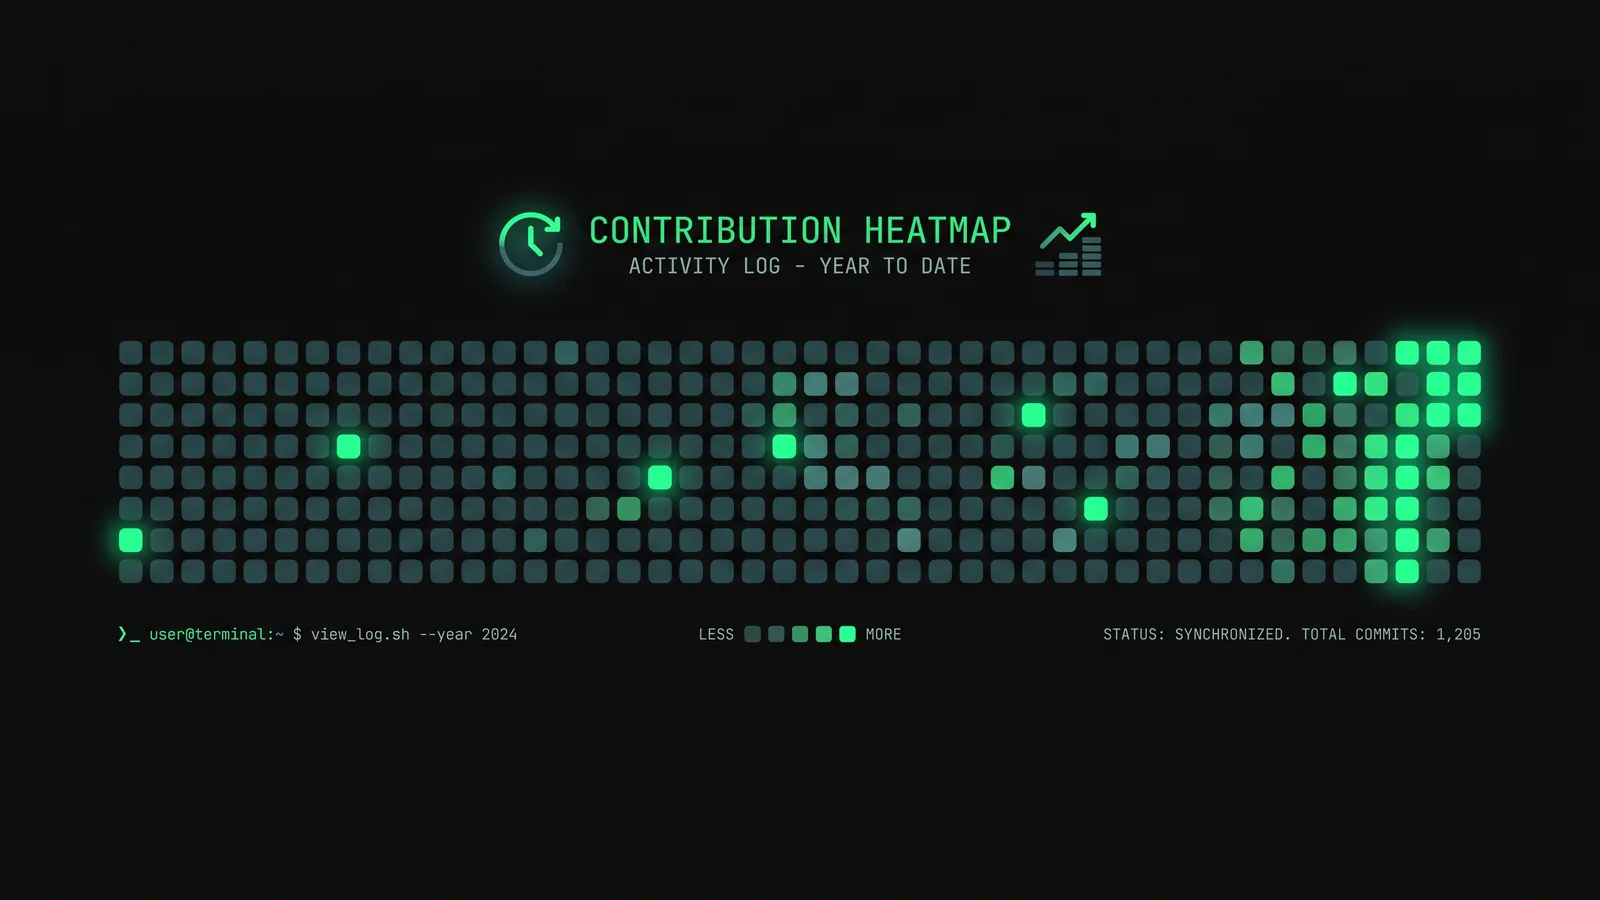
A CLI that prints GitHub-style contribution heatmaps for your AI coding-tool usage. Plug it into Claude Code / Codex / Cursor / OpenCode and see the year at a glance, right in the terminal.
The token-maxing era needed a scoreboard #
I wanted to see, and honestly to show off a little, how hard everyone is leaning on their AI coding tools now. The data already exists: Claude Code, Codex, Cursor, and OpenCode all log token usage locally. The problem is it is scattered across four completely different formats and there is no single view. TokenViz unifies them into one heatmap, with zero config and no account.
Where the data actually comes from #
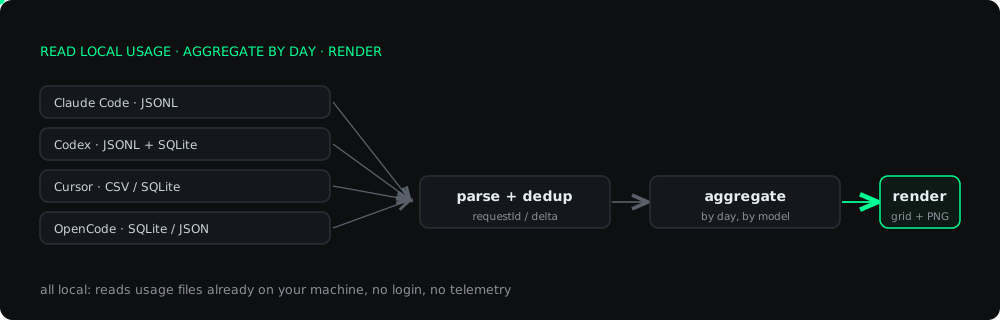
Everything is read from files already on your machine, one adapter per tool, and the messy part is that each tool stores usage differently: Claude Code in project JSONL, Codex in dated JSONL plus a SQLite state DB, OpenCode in SQLite or JSON, and Cursor behind its own dashboard API (with a local SQLite fallback). Adapters auto-detect which tools are present and run in parallel.
Rendered twice from one model #
The same grid is drawn two ways. The terminal version uses ANSI block glyphs via chalk; the shareable version is hand-built SVG rasterized to a 4000px PNG with resvg. One detail I care about: the SVG color ramp is gamma-corrected (pow 0.7) so light-usage days stay visible instead of washing out to near-black, and there are ten themes to pick from.
Local by design #
It reads files, it does not phone home: no login, no telemetry, no account. The one network call is optional, Cursor's own usage export, made with your local token and only for your own data, and it falls back to reading Cursor's local SQLite if that fails. Written in strict TypeScript ESM, shipped on npm, run with a single npx tokenviz.